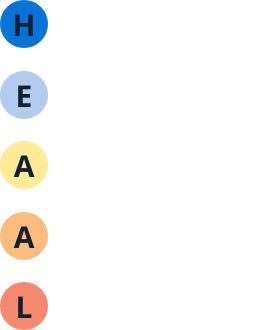
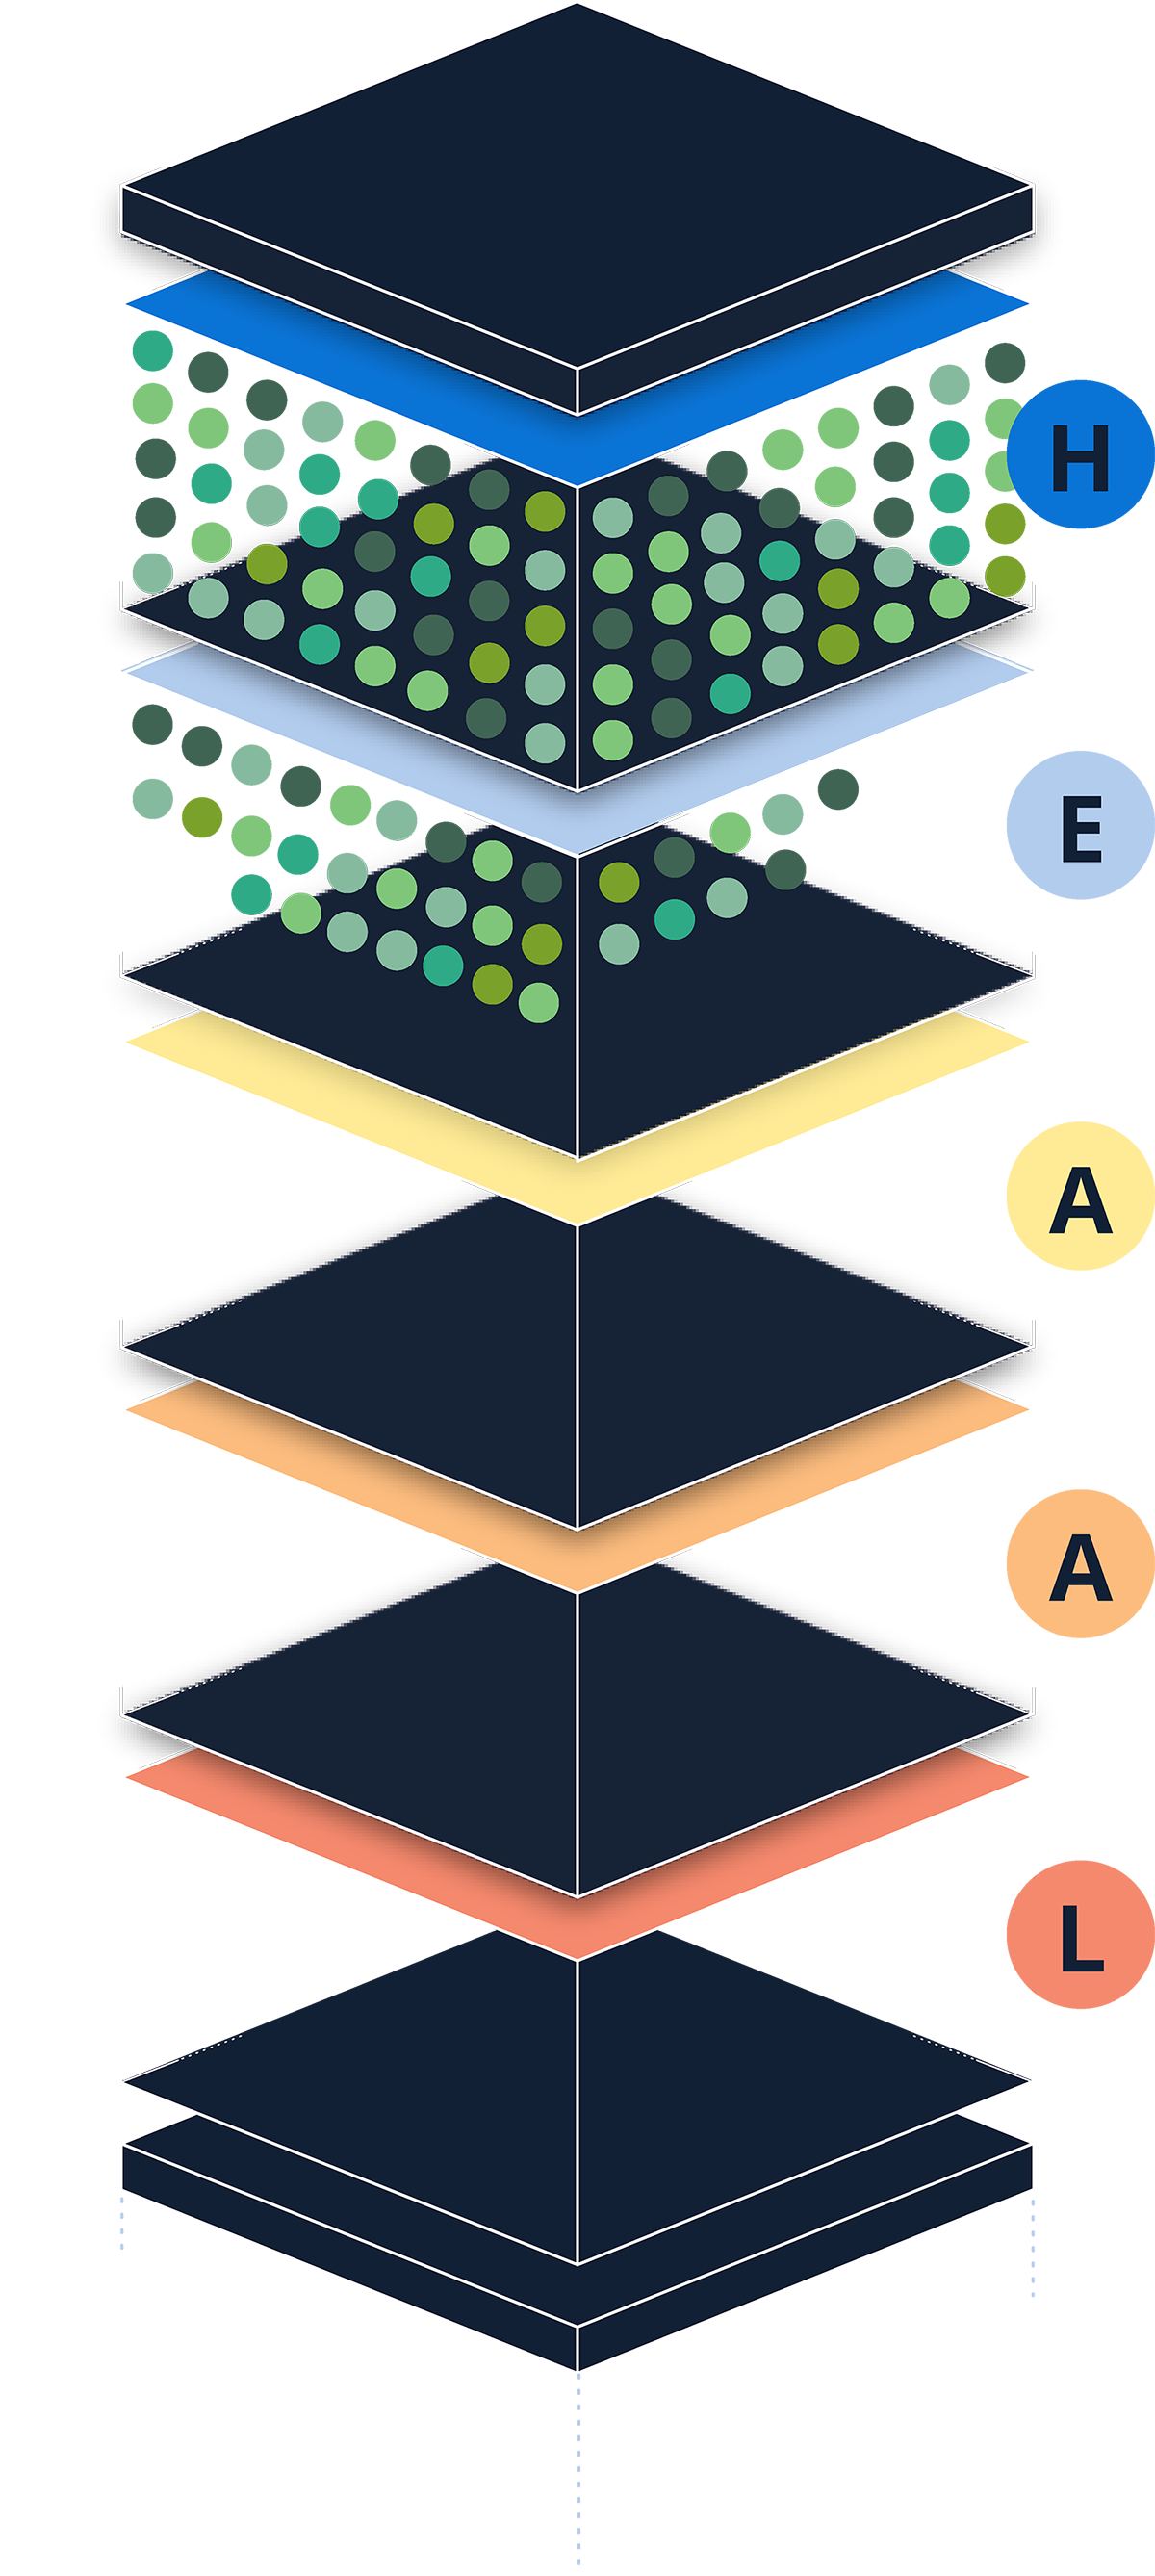
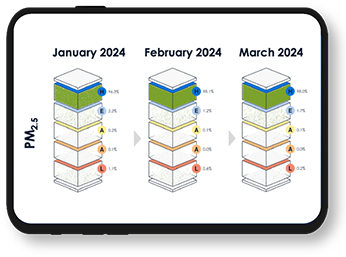
H.E.A.A.L. stands for the five threshold bins that are used to evaluate IAQ impacts on health, comfort, and productivity.
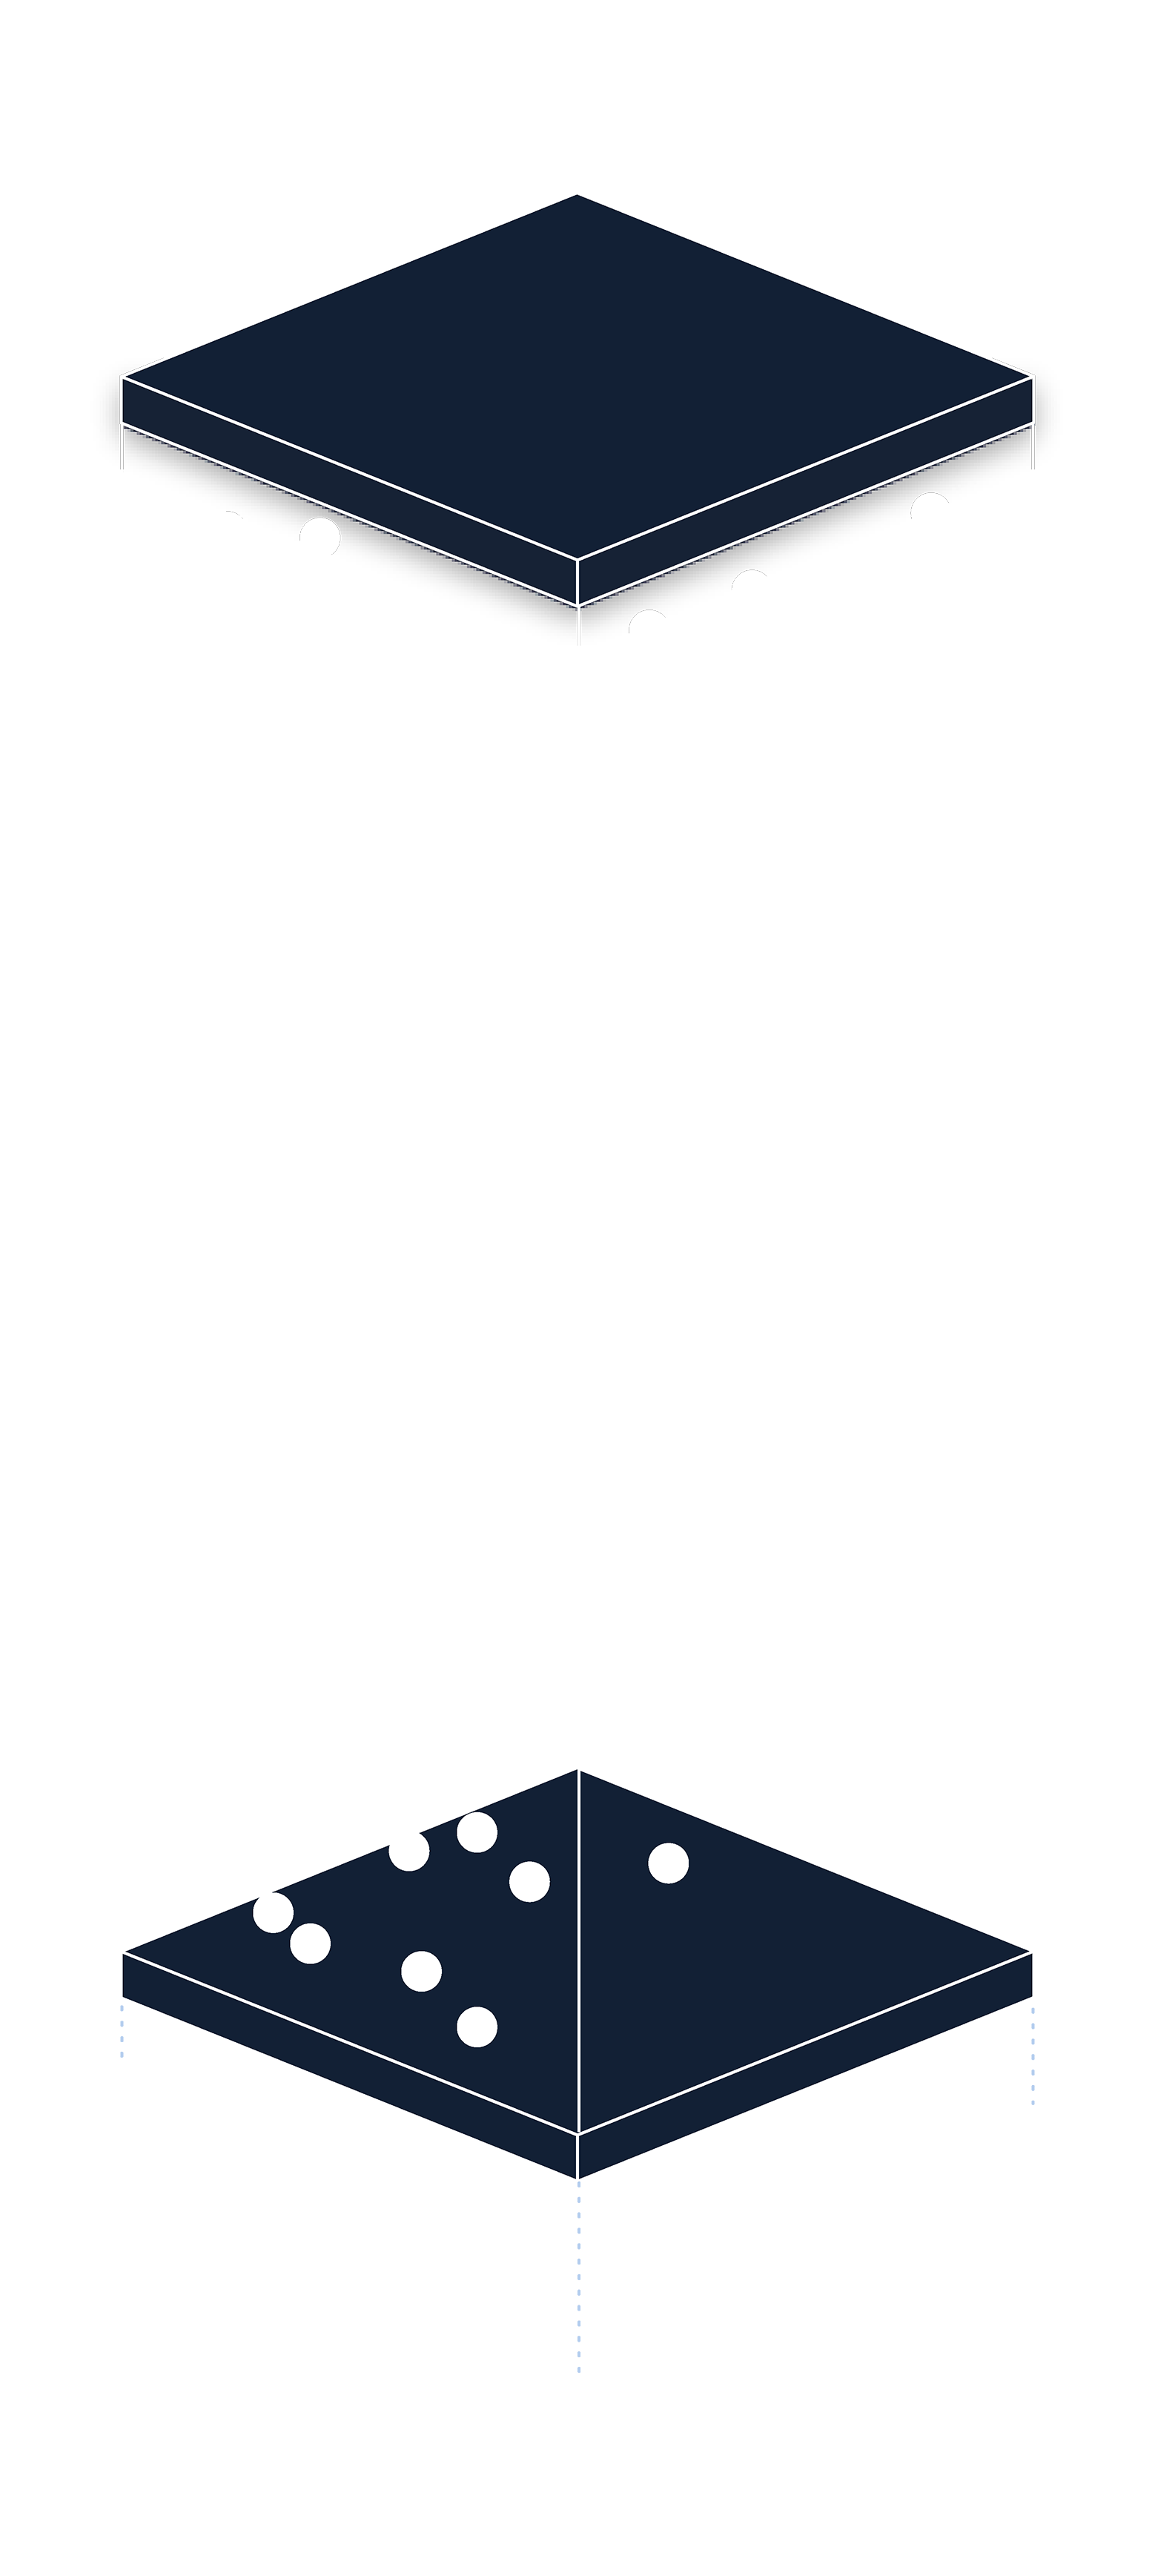


Collect Raw Environmental Sensor Data
Raw indoor environmental quality data is collected by sensors in a building.
Aggregate
Raw Data
Raw data are aggregated into rolling averages covering the building's occupied hours.
Compare against the H.E.A.A.L. Exposure Thresholds
Averages are compared against parameter-specific thresholds.
Score
the Building
The building's indoor air quality, thermal, and noise scores, as well as action, alert, and limit notifications, are based on how data compare to the parameter-specific thresholds.
The Science Behind H.E.A.A.L.
9F’s patented H.E.A.A.L. ecosystem is an innovation in real-time indoor air quality monitoring, designed to transform complex air quality data into actionable, health-focused insights. Built on decades of indoor air quality science and using advanced methodologies like AI/ML, H.E.A.A.L. solves critical problems in the indoor air quality data space and meets key stakeholder needs.
The Science
H.E.A.A.L is a scientifically defensible tool to aid in making environmental risk decisions for an organization.
Real-time Performance
Dashboards with H.E.A.A.L. integrations show what is happening in a building in real time and highlight key areas where updates to controls may be warranted.
Insights
Regular monthly insights reports for buildings and portfolios confirm indoor environmental quality is health optimized and identify areas for improvement.
Response
Building reports or indoor environmental quality incident investigation reports aid in follow-up investigations and support decision-making in times of crisis.
Communications
Summaries of indoor environmental quality performance help people feel confident in the indoor air quality at a building.
For the past two years, 9F has partnered with Amazon to develop a best-in-class Indoor Air Quality program.
The program includes deployment of air quality sensors across Amazon’s global corporate portfolio and ongoing data analytics through our patented H.E.A.A.L. IAQ System.
This program and H.E.A.A.L. were featured in Harvard Business Review.
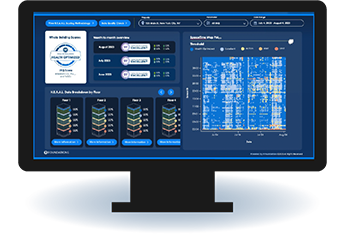
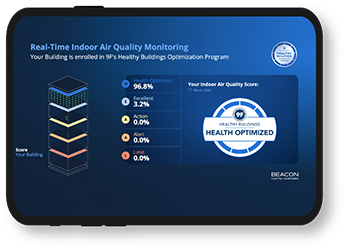
Real-time Indoor Air Quality Monitoring on Display
An effective indoor air quality (IAQ) monitoring program is key to a data-driven approach to managing buildings for health.
9F analyzes IAQ sensor data from client buildings enrolled in the Healthy Buildings Optimization Program to verify optimal IAQ and track the ‘pulse’ of each building while identifying opportunities for health- and sustainability-promoting improvements.
Designed with building occupants in mind, Real-time IAQ Displays from 9F are deployed to each participating building’s common spaces to promote awareness, transparency, and engagement to enhance understanding of the industry-leading healthy building strategies.

 H.E.A.A.L. In Action
9F’s H.E.A.A.L. includes a series of visualizations and analytical models that use IAQ sensor data to quickly see whether buildings are optimizing human health and environmental performance.
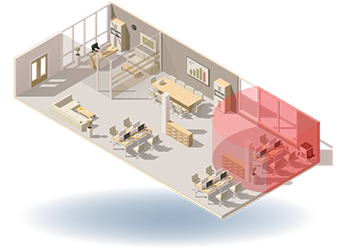
Operational Resilience Mapping
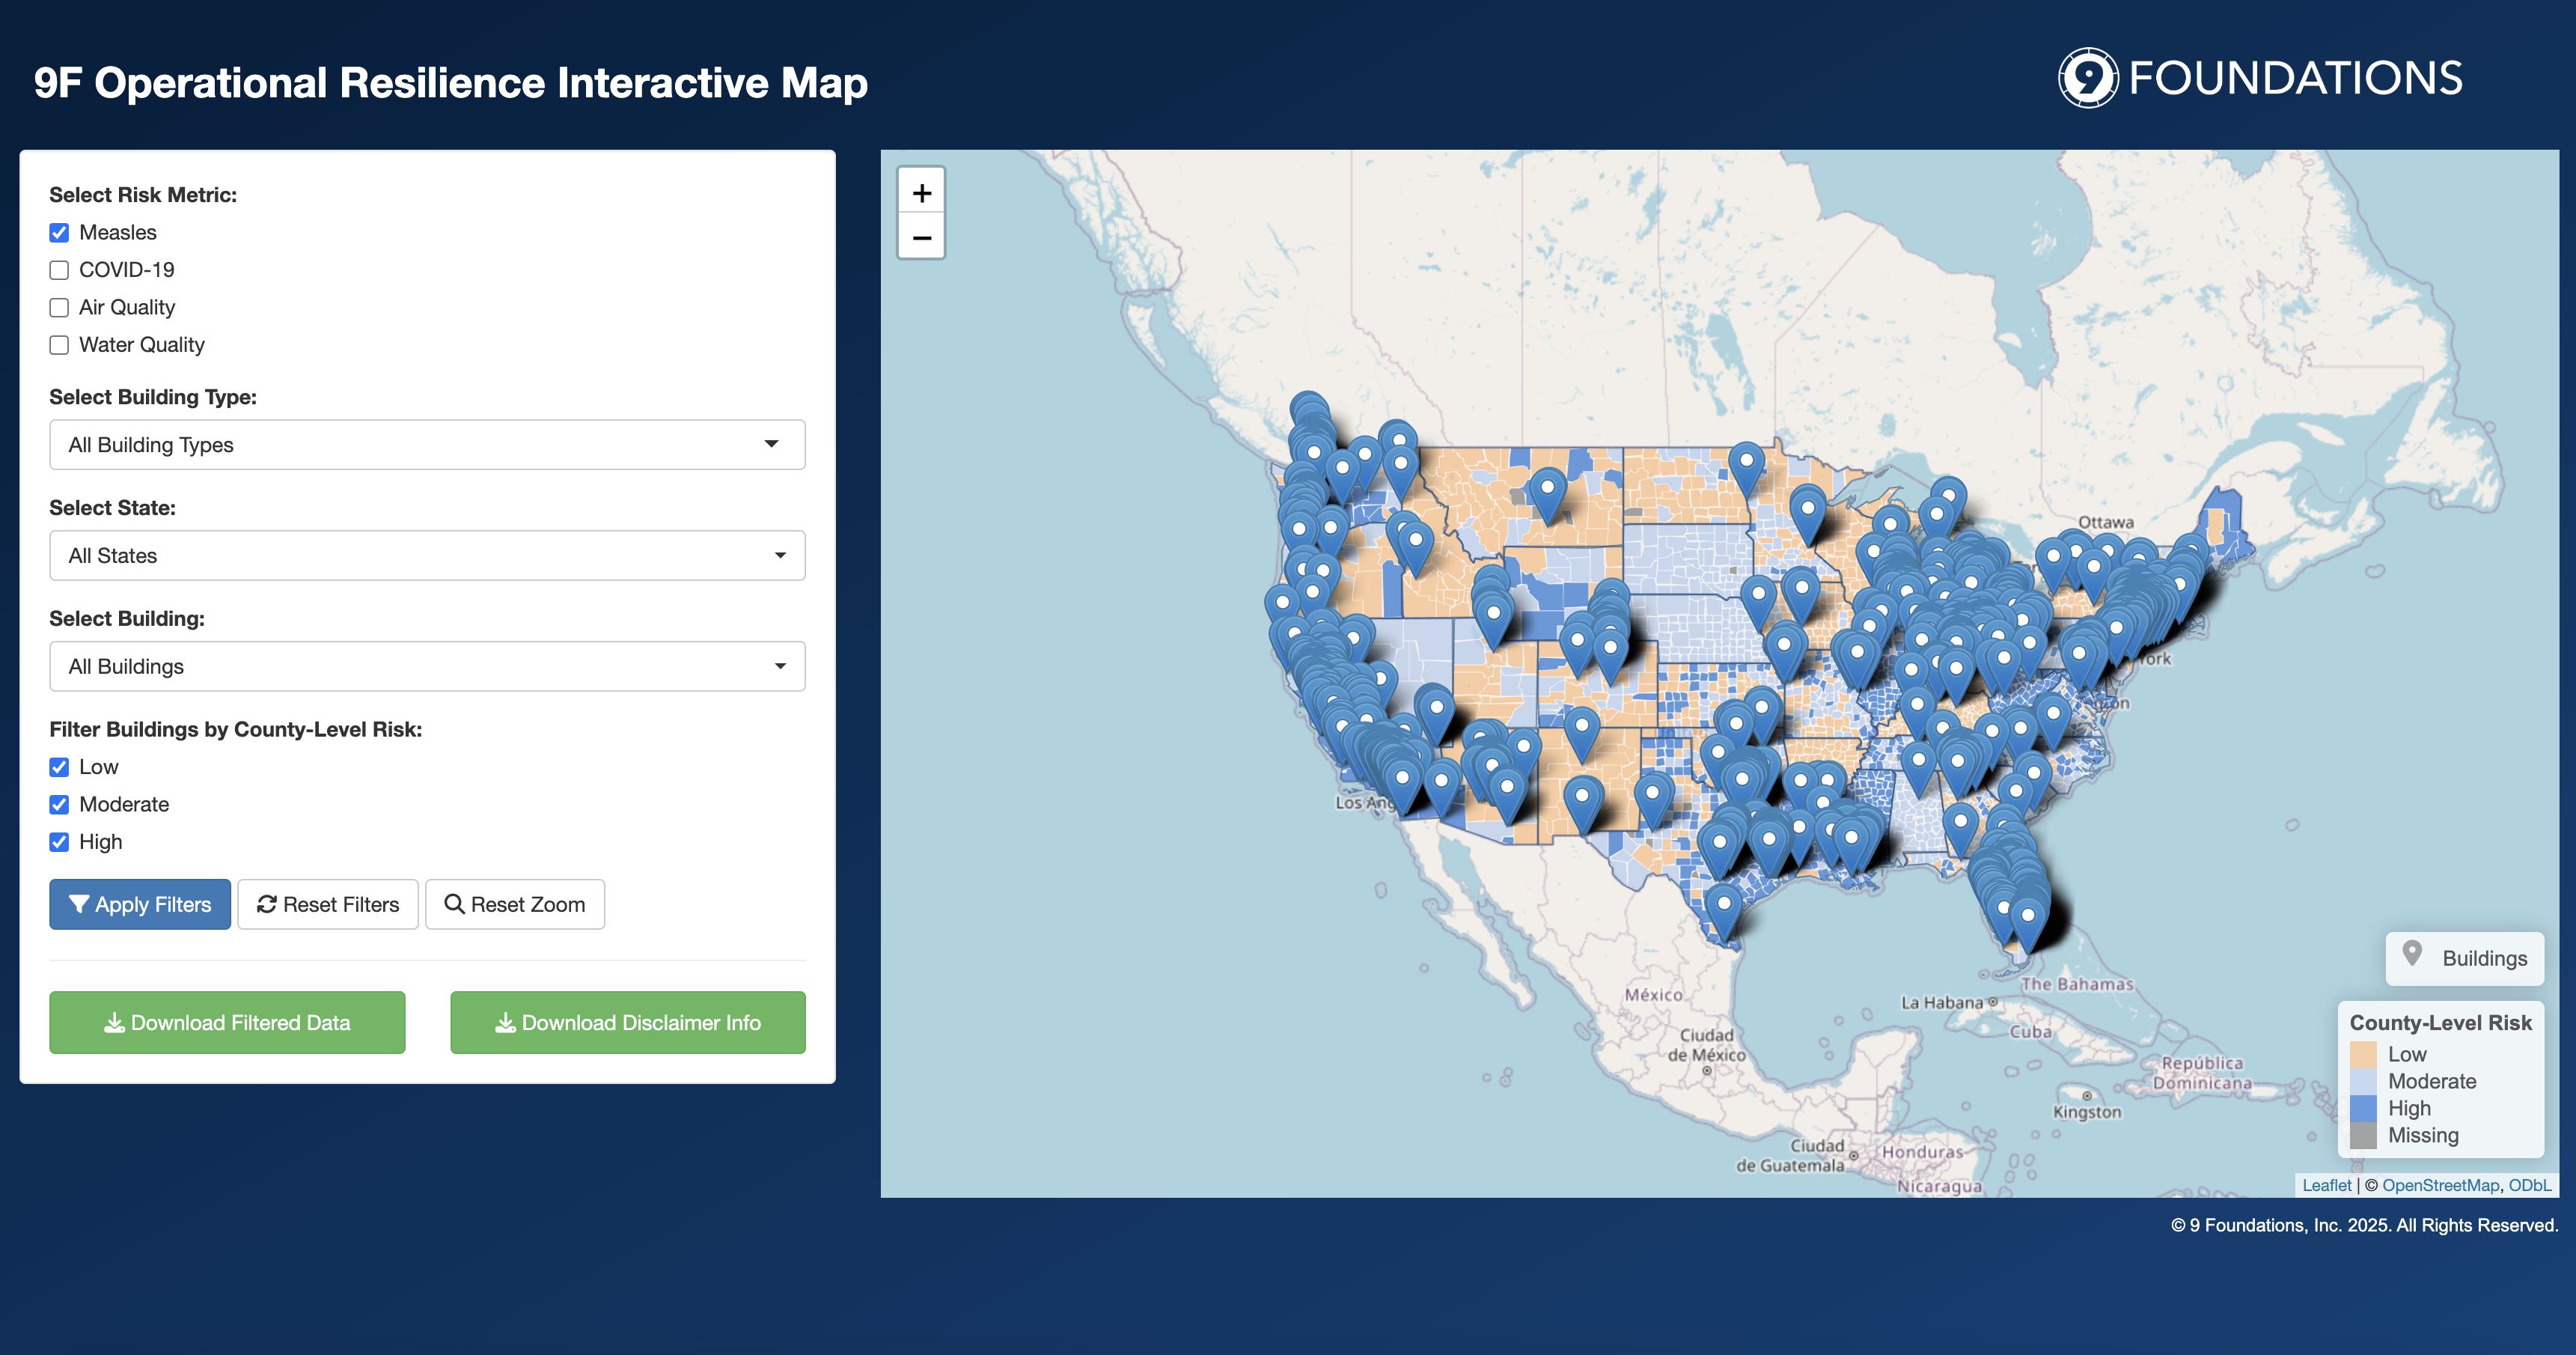
Indoor air shouldn’t be compromised.
9F developed a tool to support operational resilience for our clients. Environmental variables we integrate in our resiliency planning include infectious disease, such as measles and COVID-19; air quality; and water quality.
With 9F’s Outdoor Air Pollution Monitoring & Alert System, scientists monitor the Air Quality Index (AQI) forecasts for fine particulate matter (PM2.5) and generate advanced air quality warnings for clients when forecasts become unhealthy, such as from wildfire smoke, triggering buildings to act before outdoor air quality impacts indoor quality.